Observability in Action: Langfuse Tracing
See how DSPy.rb's executor-driven telemetry keeps real-time visibility without slowing down your LLM workflows
Vicente Reig
Fractional Engineering Lead • • 8 min read
You don’t need Neo’s Matrix X-Ray Vision to understand what’s going on in your workflows and agents.
When building production LLM applications, visibility into what’s happening under the hood isn’t optional—it’s essential. DSPy.rb’s observability system, powered by an executor-driven telemetry pipeline, provides that visibility without the typical complexity.
The Reality of LLM Observability
Most LLM frameworks bolt on observability as an afterthought. You end up monkey-patching HTTP clients, wrestling with complex instrumentation, or writing custom logging that breaks when you upgrade dependencies.
DSPy.rb takes a different approach: observability is built into the architecture from day one. Every prediction, every reasoning step, every API call is automatically tracked and exported to your monitoring systems.
Zero-Config Langfuse Integration
First, add the sibling gems so observability stays optional:
gem 'dspy'
gem 'dspy-o11y'
gem 'dspy-o11y-langfuse'
Then provide your Langfuse credentials—no config files, no custom instrumentation, just environment variables:
export LANGFUSE_PUBLIC_KEY=pk-lf-your-public-key
export LANGFUSE_SECRET_KEY=sk-lf-your-secret-key
That’s it. Your DSPy applications immediately start sending structured traces to Langfuse.
What Gets Tracked Automatically
Let’s look at what the coffee shop agent from our concurrent processing example produces in Langfuse:
Raw Telemetry Stream
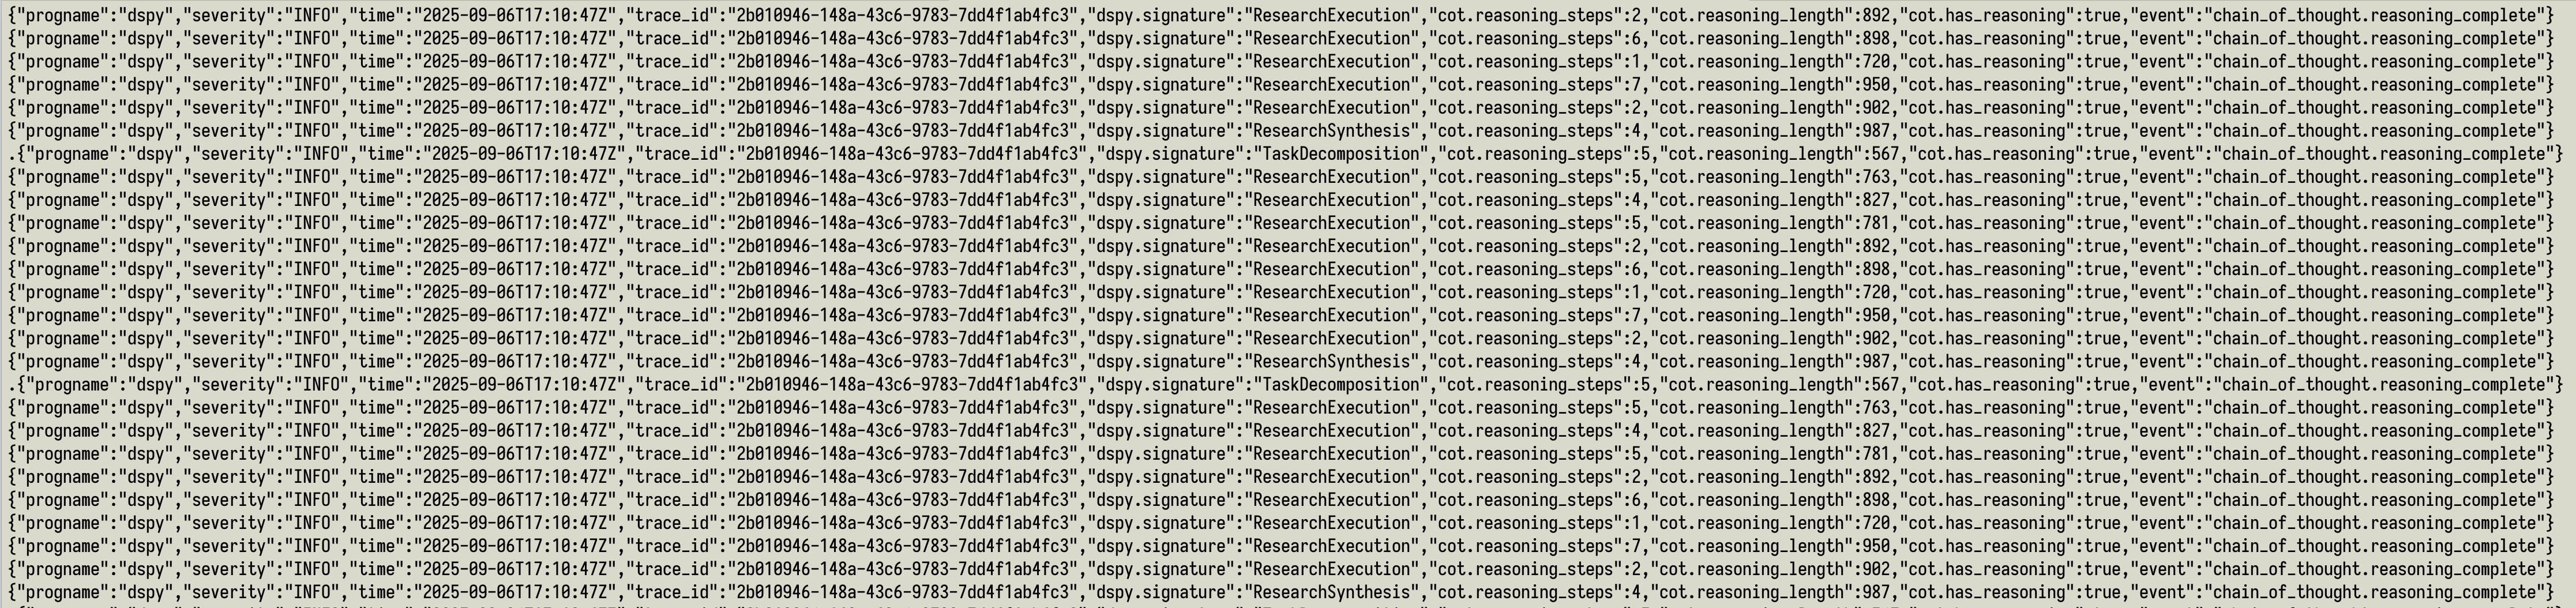
This shows the real-time telemetry stream. Each line represents an event from the coffee shop agent processing multiple customers concurrently. You can see:
- Concurrent execution: Multiple
ResearchExecutionandChainOfThoughtReasoningCompleteevents happening simultaneously - Trace correlation: Each event includes trace IDs that connect related operations
- Semantic naming: Events follow OpenTelemetry conventions (
llm.generate,chain_of_thought.reasoning_complete) - Automatic timestamping: Precise timing data for performance analysis
Structured Trace Details
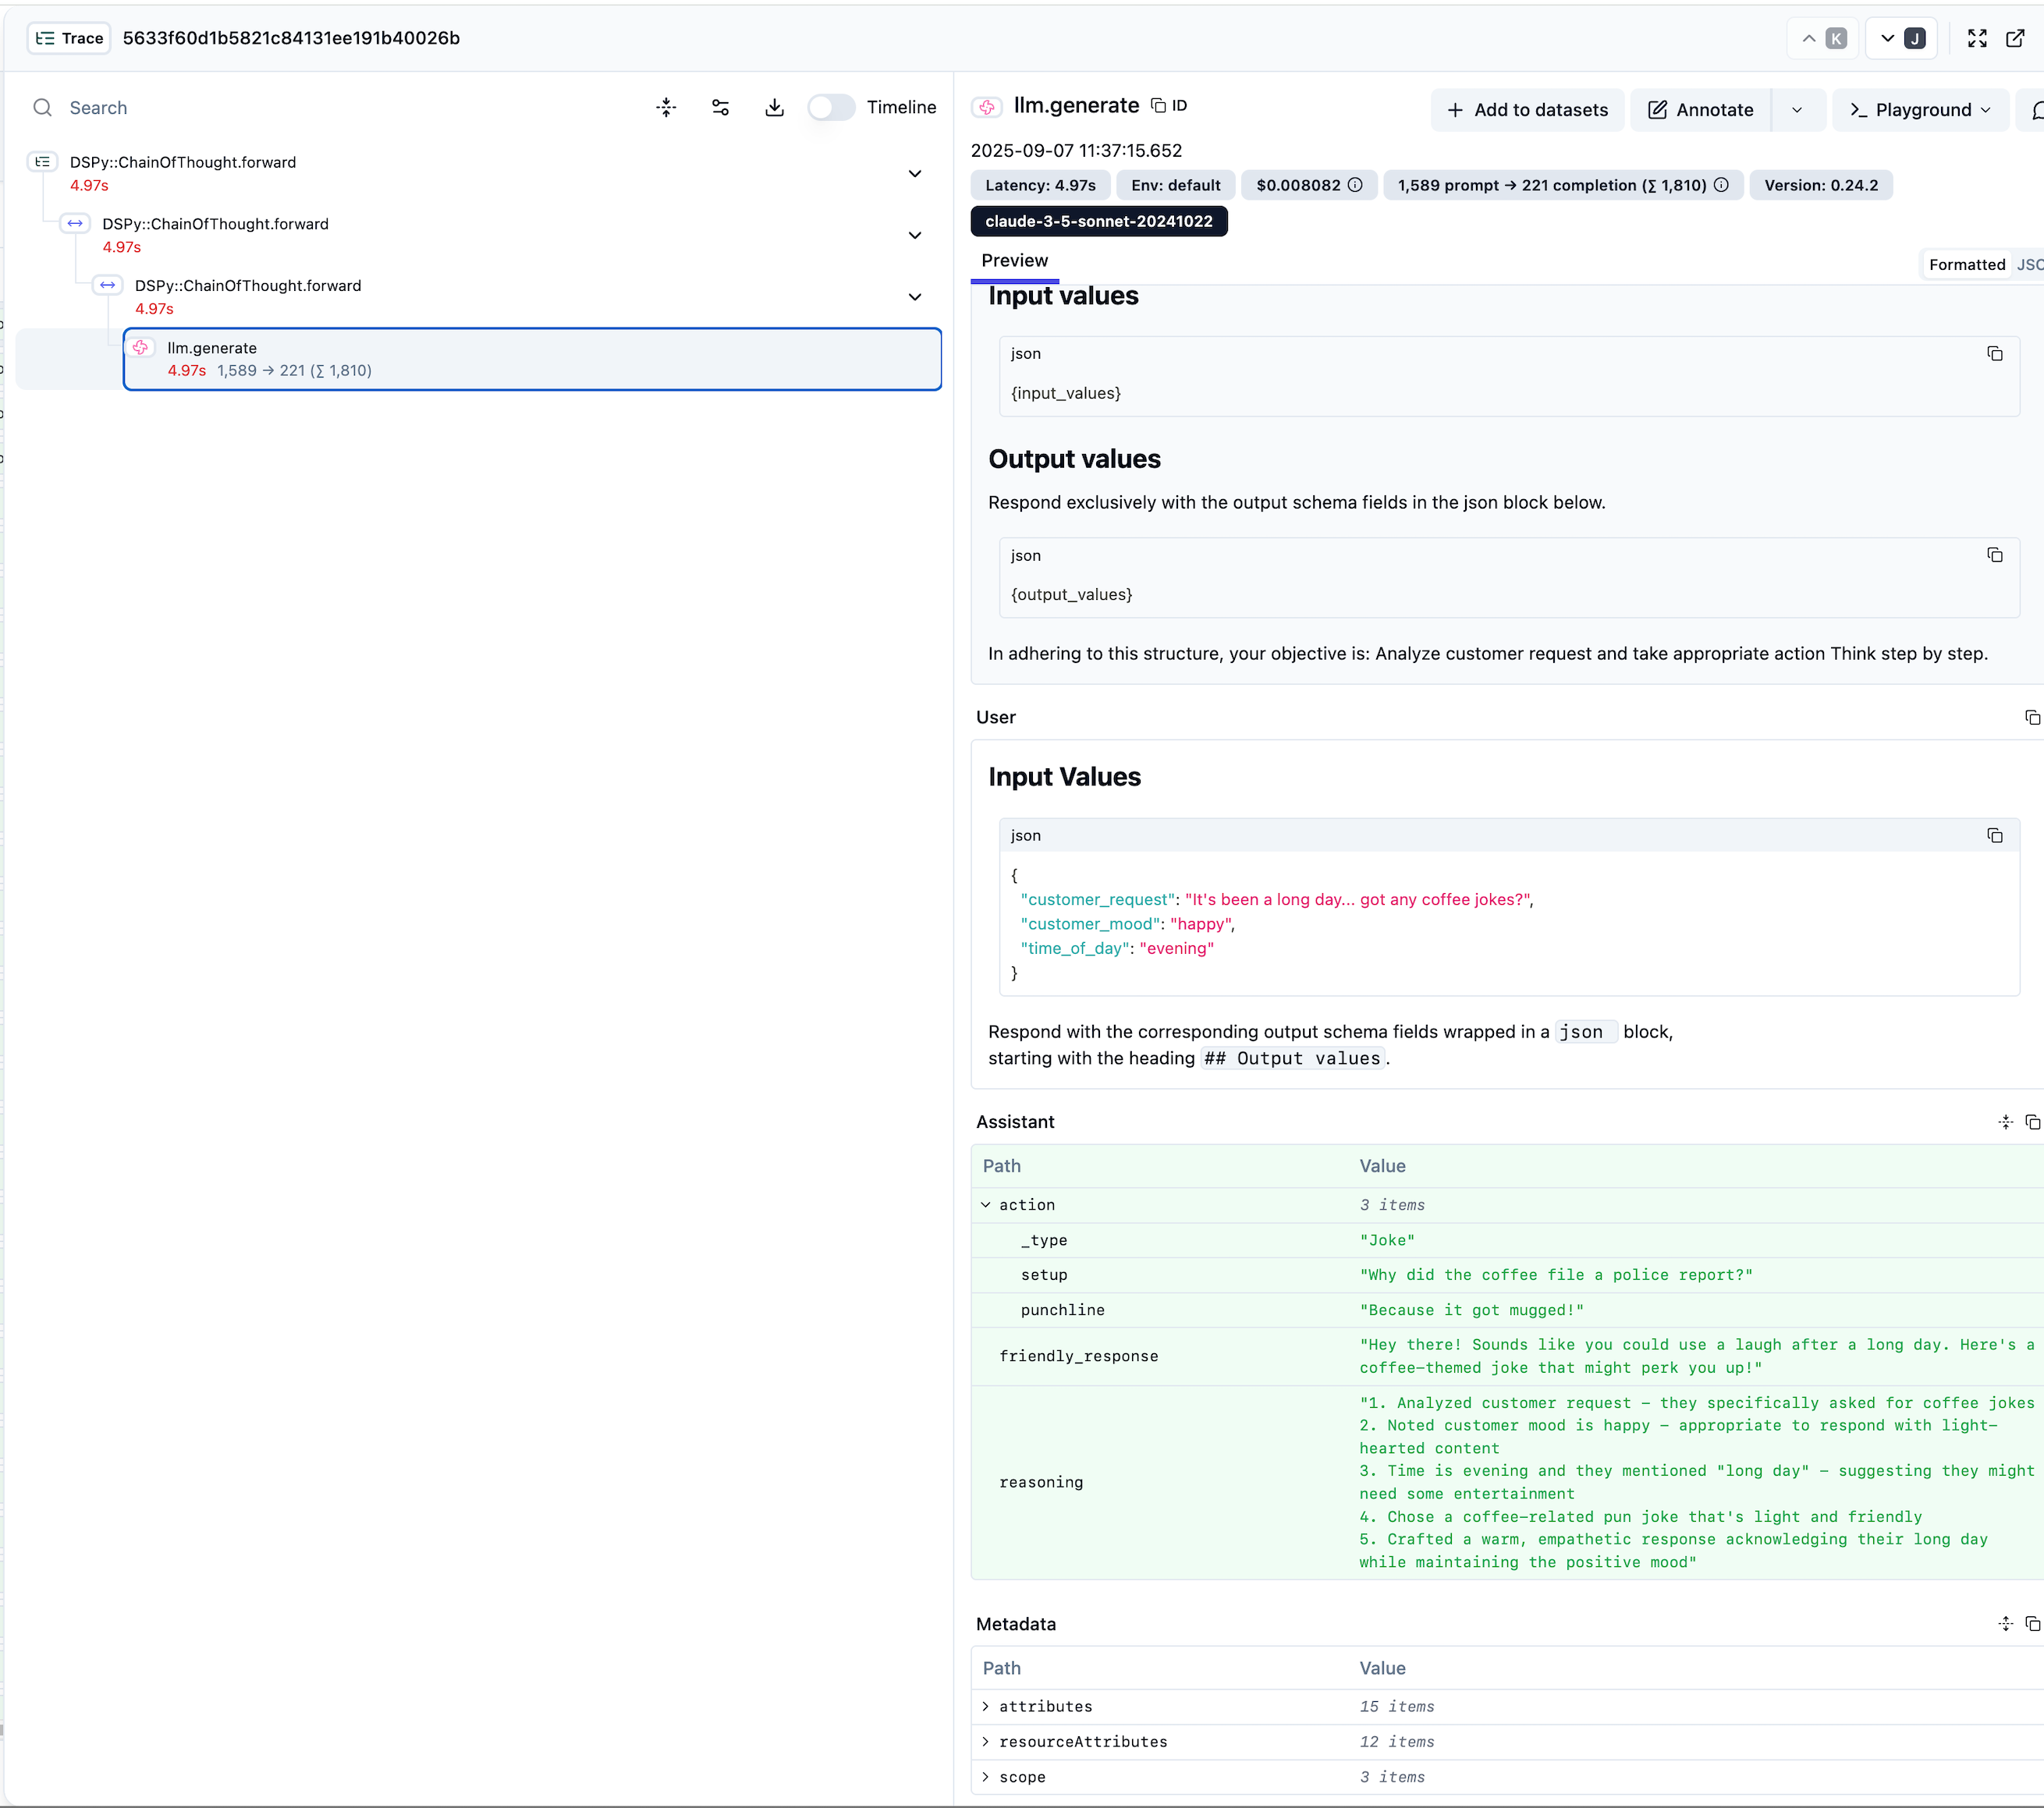
This trace detail view shows what happens when processing a single customer request:
- Input/Output Capture: Clear view of customer request and agent response
- Reasoning Visibility: The agent’s step-by-step thought process is captured
- Action Results: Shows the final action taken (in this case, a coffee joke)
- Token Usage: Automatic tracking of prompt and completion tokens
- Timing Information: Precise duration measurements for optimization
Serialized Export Reliability
The telemetry system now routes exports through a dedicated Concurrent::SingleThreadExecutor, keeping observability non-blocking while guaranteeing only one OTLP HTTP client is active at a time:
# From lib/dspy/observability/async_span_processor.rb
class AsyncSpanProcessor
  def initialize(exporter, ...)
    @export_executor = Concurrent::SingleThreadExecutor.new
    @queue = Thread::Queue.new
  end

  def on_finish(span)
    @queue.push(span)  # Non-blocking enqueue with overflow protection
    trigger_export_if_batch_full
  end

  private

  def schedule_async_export(export_all: false)
    @export_executor.post { export_queued_spans_internal(export_all:) }
  end
end
This delivers:
- Zero performance impact: Export work runs on the executor thread, never blocking callers.
- Resilience: Failed exports retry with exponential backoff while the worker thread sleeps between attempts.
- Batched efficiency: Spans are drained from the queue in batches before being exported.
- Overflow protection: Queue limits and FIFO dropping prevent memory issues.
What You Get For Free
With this setup, every DSPy module automatically provides:
LLM Operation Tracking
- Model and provider identification
- Token usage and cost calculation
- Request/response timing
- Error rates and retry patterns
Module Execution Flow
- ChainOfThought reasoning steps
- ReAct iteration patterns
- CodeAct code execution results (requires the
dspy-code_actgem) - Custom module performance
Concurrent Processing Insights
- Fiber-level request isolation
- Parallel execution visualization
- Resource utilization patterns
- Bottleneck identification
Performance in Practice
Using the coffee shop agent example, we can see the observability overhead:
- Sequential execution: ~20-25 seconds (measured)
- Concurrent execution: ~7.5 seconds (measured)
- Telemetry overhead: <50ms additional (negligible)
The executor-driven telemetry design ensures observability doesn’t slow down your applications.
Beyond Basic Monitoring
The event system supports custom analytics:
class TokenBudgetTracker < DSPy::Events::BaseSubscriber
  def subscribe
    add_subscription('llm.*') do |event_name, attributes|
      tokens = attributes['gen_ai.usage.total_tokens'] || 0
      @total_tokens += tokens

      raise BudgetExceededError if @total_tokens > @budget_limit
    end
  end
end
This enables:
- Real-time budget enforcement
- Custom alerting on usage patterns
- Performance regression detection
- Cost optimization insights
The Bottom Line
DSPy.rb’s observability isn’t an add-on feature—it’s architectural. The executor-driven telemetry system provides production-grade visibility without the typical complexity or performance costs.
You get Matrix-level visibility into your LLM workflows, but without needing to be Neo to understand what’s happening.
This feature is available in DSPy.rb v0.25.0+. The concurrency-aware telemetry optimizations are part of the ongoing improvements to DSPy.rb’s production readiness.